1. Nanopore Project
2. Functional Genomics
3. Collaborations
The objective of the nanopore project is to design, fabricate and experimentally validate a nanopore sensor for detection of single molecules of biological polymers such as nucleic acids (i.e. DNA and/or RNA). To guide the fabrication of solid-state nanopores, experiments are iteratively correlated with modeling work. The computer model currently under development aims to calculate ionic currents and current blockades for biological as well as solid-state nanopores and to examine the influence of various geometries and chemical compositions of the nanopore on the transport of nucleic acid polymers. The nanopore sensor is expected to have unmatched speed and sensitivity of DNA detection and sequencing, enabling personalized molecular medicine, revolutionary modification of agriculture and food industry, and decoding of ecosystem-wide genetic variation. It will also provide a robust sensor for detection and identification of terrestrial and extraterrestrial information-encoding biopolymers for identification of individual terrestrial and extra-terrestrial organisms.
The study of biological systems at the molecular scale provides valuable information that has proven useful for nanoscale engineering. One such example is the alpha-hemolysin  protein toxin (~33.2 kD) that is produced by a spherical bacterium called Staphylococcus aureus . The alpha-hemolysin protein spontaneously self-assembles into a large (~100 Å) heptameric channel that inserts itself into cellular membranes causing leakage of ions and small organic molecules. Academic groups at Harvard University and the University of California at Santa Cruz among others used this protein as a model system for structural analysis of nucleic acids by deciphering ionic signature patterns in the genetic code of nucleic acids. Experimental studies with the protein pore show that single stranded nucleic acid polymers in extended linear configuration are transported through the alpha-hemolysin channel under the action of an applied electric field. Translocation protein toxin (~33.2 kD) that is produced by a spherical bacterium called Staphylococcus aureus . The alpha-hemolysin protein spontaneously self-assembles into a large (~100 Å) heptameric channel that inserts itself into cellular membranes causing leakage of ions and small organic molecules. Academic groups at Harvard University and the University of California at Santa Cruz among others used this protein as a model system for structural analysis of nucleic acids by deciphering ionic signature patterns in the genetic code of nucleic acids. Experimental studies with the protein pore show that single stranded nucleic acid polymers in extended linear configuration are transported through the alpha-hemolysin channel under the action of an applied electric field. Translocation  of such polymers causes partial blockades of the channel's ionic current. The number, intensity and duration of fractional blockades is observed to be a fingerprint for various nucleic acids homopolymers (Table 1). The subunit-specific variation of amplitude and duration of ionic current modulation suggests that nanopore sensors could be used for direct reading of DNA sequence . of such polymers causes partial blockades of the channel's ionic current. The number, intensity and duration of fractional blockades is observed to be a fingerprint for various nucleic acids homopolymers (Table 1). The subunit-specific variation of amplitude and duration of ionic current modulation suggests that nanopore sensors could be used for direct reading of DNA sequence .
|
Polymer
|
Speed (ms/nucleotide)
|
Inhibition (%)
|
|
rU
|
~1
|
85-100
|
|
rA
|
~20
|
85
|
|
rC
|
~3
|
95
|
|
The Sequencing Concept
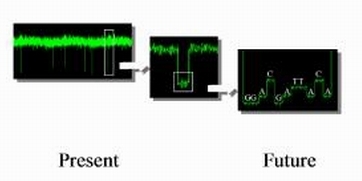 |
Due to the fast translocation rate and the small differences in the levels of ionic current blockade between various nucleic acids, signal processing to achieve the desired single nucleotide resolution is presently still a challenge. Research has shifted to experimentation and modeling of the translocation of nucleic acid polymers through a solid-state nanopore, which may enable a more robust temporal control of the transport phenomena.
To enable resolution of ionic signatures produced by individual subunits of nucleic acids, we developed a data acquisition system . This hardware-software system enables rapid detection and acquisition of ionic signatures produced by individual molecules of nucleic acid in the nanopore.
|
Data acquisition signal
|
Because experimental ion current determinations and polymer translocation data are presently limited for solid-state nanopores, the structure  of the alpha-hemolysin protein channel provides a useful intermediate model to identify fundamental functional principles. The modeling results of the alpha-hemolysin system are used to identify the key characteristics of the channel structure-function relationship, and to design a robust solid-state nanopore that is iteratively validated experimentally. Various computer simulations and theoretical models have been previously used to model current-voltage profiles . of the alpha-hemolysin protein channel provides a useful intermediate model to identify fundamental functional principles. The modeling results of the alpha-hemolysin system are used to identify the key characteristics of the channel structure-function relationship, and to design a robust solid-state nanopore that is iteratively validated experimentally. Various computer simulations and theoretical models have been previously used to model current-voltage profiles .
|
Scheme to combine various models to calculate the current-voltage profile for the alpha-hemolysin channel.
|
Continuum theories such as the Poisson-Nernst-Planck and Eyring Rate allow relatively quick computations of ionic fluxes and translocation times without accounting for fine structural details. Their output also largely depends on the choice of input parameters for the diffusion coefficient of ions, system charges, and energetic barriers that can be more accurately determined from atomistic simulations but can not reach time scales of physiological interest (~100 nanoseconds to 1 microsecond) with the present computational resources. To calculate the alpha-hemolysin open channel ionic currents, a hybrid MD-PNP model is used. Modeling of the nanopore system is done using local computational resources . For the atomistic Molecular Dynamics (MD) simulations, the following software packages are used: NAMD , AMBER , VMD , GRID20 (developed at the Laboratory of Chemometrics,University of Perugia ), Cerius2 , InsightII , CHARMM (academic version). The PNP model uses partial differential equation (PDE) solvers, developed at NASA Ames Research Center (Deepak Bose ) readily modified, as distinct from commercially available PDE software.
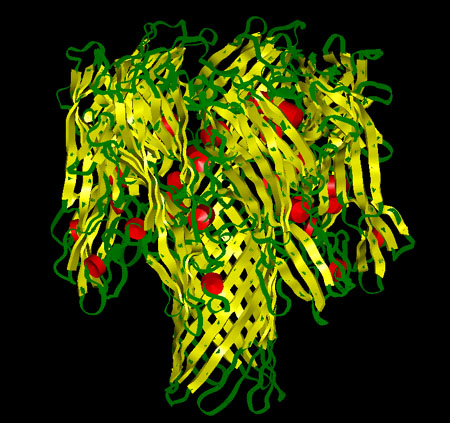
The structure of the alpha-hemolysin channel from Staphylococcus aureus has been determined to 1.9 Å resolution via X-ray diffraction. It revealed a mushroom shaped 100 Å long heptameric (seven identical chains) complex composed of a cap and a stem domain. A solvent filled channel that ranges from 11 Å to 45 Å in diameter is contained within the heptamer. The cap domain protrudes from the membrane bilayer and is formed by seven beta sheets. The transmembrane domain, called the stem, is the lower half of the channel, a beta-barrel formed by 14 antiparallel strands. The stem interior is primarily hydrophilic in nature. Hydrophilic and hydrophobic residues are positioned along the protein in alternating layers .
|
Cartoon representation of the alpha-hemolysin channel. The red cylinders represent the alpha-helix regions, the yellow ribbons represent the beta sheets and the green regions represent the protein turns.
|
|
View of the alpha hemolysin channel stem (blue). Water molecules are represented by red colored Van der Waals spheres. There are only a few ions inside the protein stem: green spheres indicate the positive K ions and light blue spheres indicate the negative Cl ions.
|
|
Amino acids hydrophobicity on the alpha-hemolysin protein according to the Engleman-Steitz scale. Calculation performed in InsightII (Accelrys Inc.).
|
Close to the connection point between the cap and the stem there is a constriction formed by three rings of amino acids. The first ring reduces the pore diameter to ~13 Å and consists of LYS amino acids (147, 440, 733, 1026, 1319, 1612, 1905). The second ring reduces the pore diameter to ~15 Å and is formed by GLU amino acids (111, 404, 697, 990, 1283, 1576, 1869). The position of the first two rings corresponds to approximately the same coordinate along the axis channel. The third ring (MET) is distanced by about 6 Å.
|
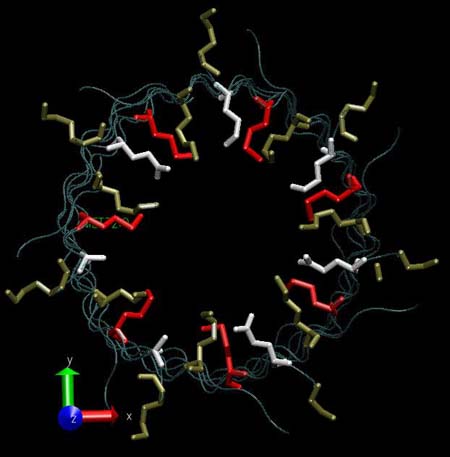
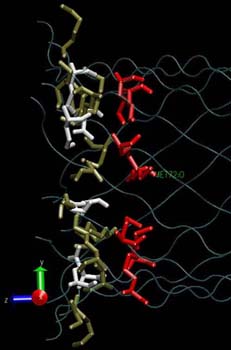
Frontal view of the three amino acids rings lying at the constriction point of the alpha-hemolysin channel: LYS (tan), MET (red) and GLU (white).
|
|
Projection in the axial plane of the alpha-hemolysin channel. The internal diameter of the pore corresponding to each position z along the channel axis is shown. The blue points represent the selection for the "reduced" representation of the pore used in the MD calculations of ion diffusion coefficients.
|
|
Lateral view of the three amino acids rings lying at the constriction point of the alpha-hemolysin channel: LYS (tan), MET (red) and GLU (white).
|
A reduced representation of the alpha-hemolysin pore solvated in a 1MKCl solution is used in the MD simulations to calculate the diffusion coefficient of the K+ and Cl- ions. Einstein's diffusion equation relating the mean square displacement of the ions as function of the simulation time via the diffusion coefficient is used. If all the ions in the unit cell are selected, a value of 1.95*10-9 m2/s is determined (dashed line ) and is comparable to the value determined for the ions in a pure 1M KCl ionic solution (1.85*10-9 m2/s, dotted line ). A smaller value (0.78*10-9 m2/s,
solid line ) is calculated if only the ions located inside the pore (and within 5 Å of its boundaries) are selected and this value is used in the PNP calculations. The diffusion coefficient of potassium ions in the alpha-hemolysin channel is reduced relative to bulk solution by a factor of 2.5 as a result of the
geometry and energetic interaction with the channel.
|
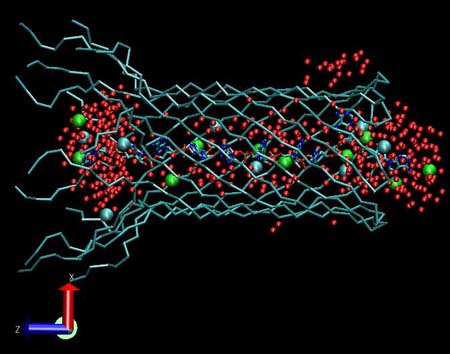
Snapshot from an MD simulation of the alpha-hemolysin system in a 1M KCl solution and an external applied electric field. The K+ (light colored spheres) and Cl- ions (dark colored spheres) inside and within 5 Å of the pore are shown using the Van Der Waals representation. The solvent (SPC/E water) is not displayed. This figure was generated using the VMD software.
|
|
Mean square displacement versus time (MD calculations) for K+ ions in: pure 1M KCl solution (dotted line), 1M KCl solution with alpha-hemolysin pore (dashed line), and KCl solution inside the alpha-hemolysin pore (solid line).
|
The best binding energies between the potassium and chloride ions and the channel are calculated. Potassium ions are highly attracted by the cis and trans ends of the protein channel, while the best binding place for the chloride ions is at the constriction point. The binding energies of the potassium ion with various nucleic acid homopolymers lay in the range of -80 kcal/mol to -47 kcal/mol. The best binding energy was calculated for poly[U].
|
Binding energies for K+ and Cl- ions in the protein channel.
|
|
Binding energies for K+ ions with various nucleic acid homopolymers.
|
In the PNP model a 2D grid (represented as concentric rings ) corresponding to a cylindrical polar coordinate system is applied over the pore stem (dark area). In contrast to the MD calculations where discrete ion positions are considered, the PNP approach assumes a continuum distribution of ions, where the ion concentration at a location is calculated as the time-averaged non-normalized probability of finding an ion at that location.
|
Schematic representation of &alpha&-hemolysin channel. In the PNP model a 2D grid (represented as concentric rings) corresponding to a cylindrical polar coordinate system si applied over the pore stem (dark area).
|
The detailed atomistic structure of alpha-hemolysin (including discrete positions of the atoms and partial charges) is used in the calculation of the electrostatic potential from the Poisson equation. The MD calculated ion diffusion coefficient enters in the Nernst-Planck equation to calculate the ionic flux/current.
|
Scheme of the MD-PNP model to calculate open channel ionic currents.
|
The open channel ionic current is 54 pA when only the channel geometry is considered. This means that the fine structural details of the stem but not the partial charges on the atoms are included. By including the pore-atoms charges, this value becomes 101 pA, comparable with the 120 pA value measured in polymer translocation experiments (Table 2). The geometry of the channel seems to be responsible for about 50% of the total ionic current and is most probably due to a mean field effect of the charges.
|
|
I (pA)
|
dN/dt (ions/s)
|
|
Pore geometry
|
54
|
3.37*108
|
|
Pore geometry and fixed charges
|
101
|
6.28*108
|
|